Overview
finbar provides tools to help you rapidly build custom new models, without having to manually extract and clean data.
This feature is still in early-access. More functionality is planned for the near future.
Reach out to your finbar representative with any feedback you may have.
Getting started
From any organization page, click “Build model” to open the model builder.
You can also open the model builder after building a time series for any table in any document.
Follow the instructions in similar tables, then click “Open full editor”.
Basics
Data is organized into tabs. Each tab represents a panel of data e.g. a balance sheet, over time.
If you opened the model builder after already looking at a time series for a table, this series
will be automatically added to the model.
Otherwise, the default is to open the Wizard, which helps you add new data to the model.
This wizard is always available by clicking the ”+” icon in the tab menu.
Model Wizard
The wizard helps you quickly add data to the model, guiding you through the process.
Series are built based on a ‘starting’ table. This table can come from any document.
finbar will automatically find equivalent tables in other documents and then match them
together into a full time series, accounting for line item changes and restatements.
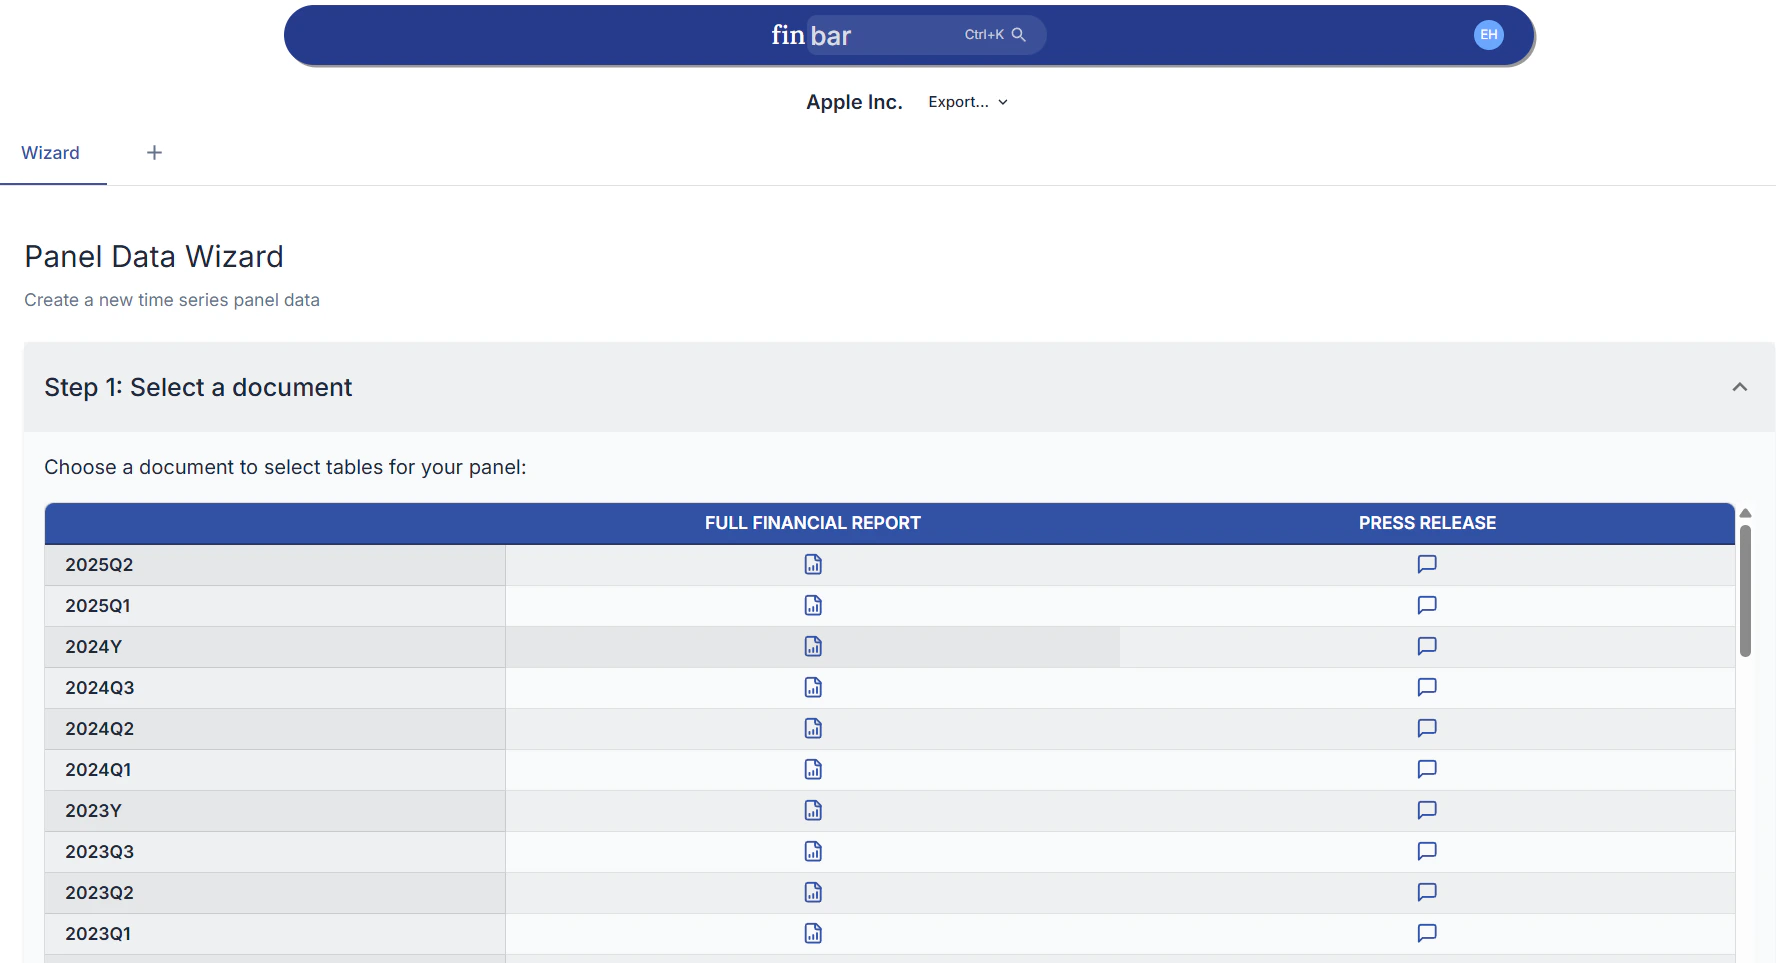
The wizard will show you a list of documents. Choose any to get started.
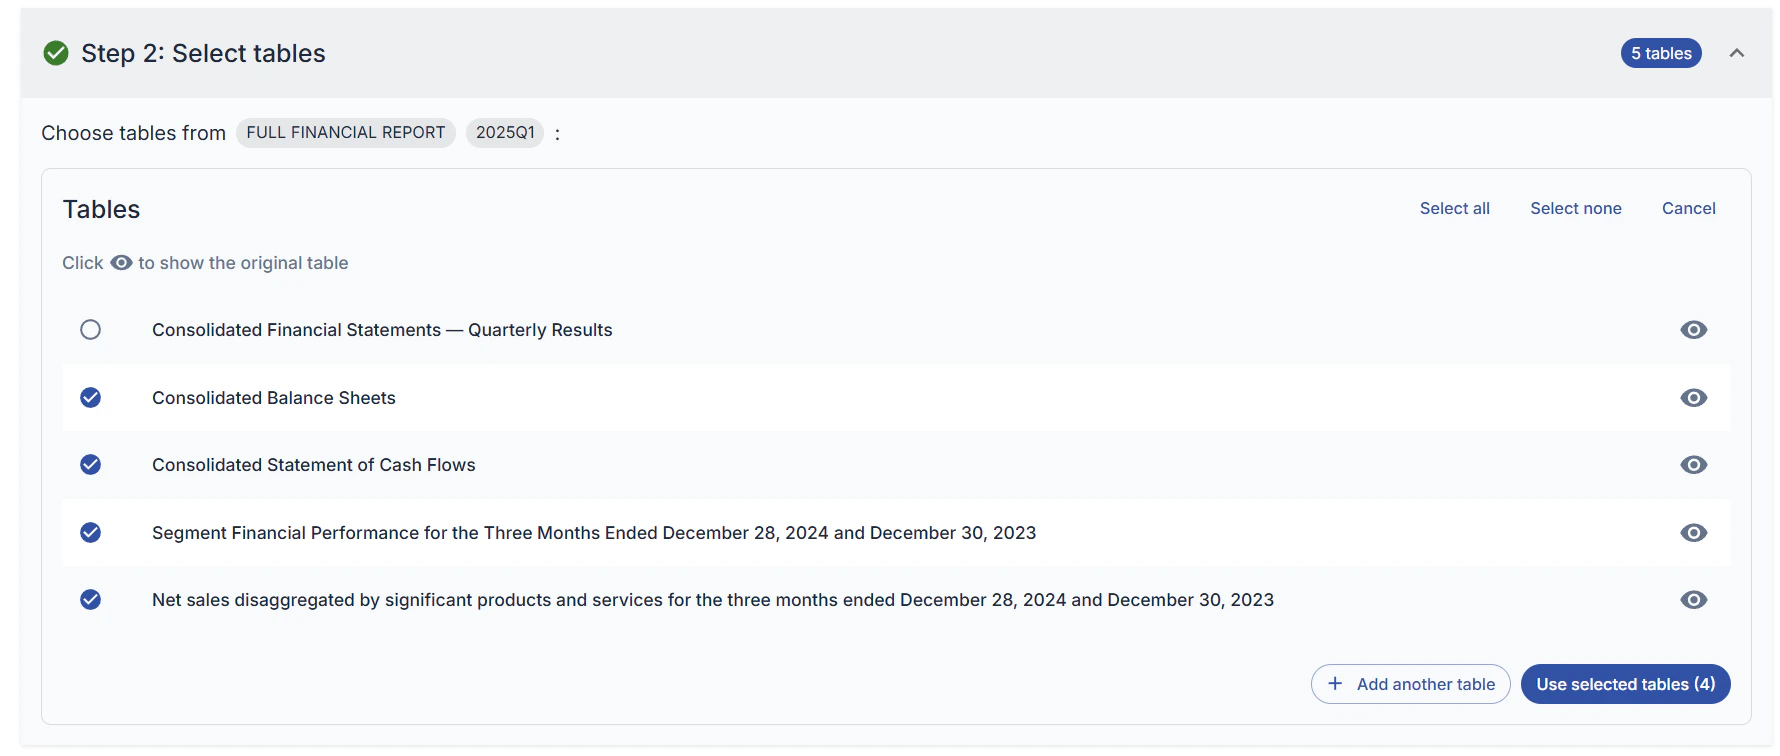
 After selecting a document, you can choose any tables within the document to use.
Each table selected will add a new tab to the model on completion.
You can either manually select tables (a popup will let you click any table in the document)
or use the “Automatically suggest appropriate tables” to allow finbar’s reasoning model
to suggest some tables for you.
As you add tables (or tell finbar to automatically suggest tables), a list will be generated.
Add additional tables by selecting “Add another table” in the bottom right of the table list.
If you change your mind, you can deselect any table you don’t want.
You can also use the ‘Eye’ icon to open the source table in the document.
When ready, select “Use selected tables”.
After selecting a document, you can choose any tables within the document to use.
Each table selected will add a new tab to the model on completion.
You can either manually select tables (a popup will let you click any table in the document)
or use the “Automatically suggest appropriate tables” to allow finbar’s reasoning model
to suggest some tables for you.
As you add tables (or tell finbar to automatically suggest tables), a list will be generated.
Add additional tables by selecting “Add another table” in the bottom right of the table list.
If you change your mind, you can deselect any table you don’t want.
You can also use the ‘Eye’ icon to open the source table in the document.
When ready, select “Use selected tables”.
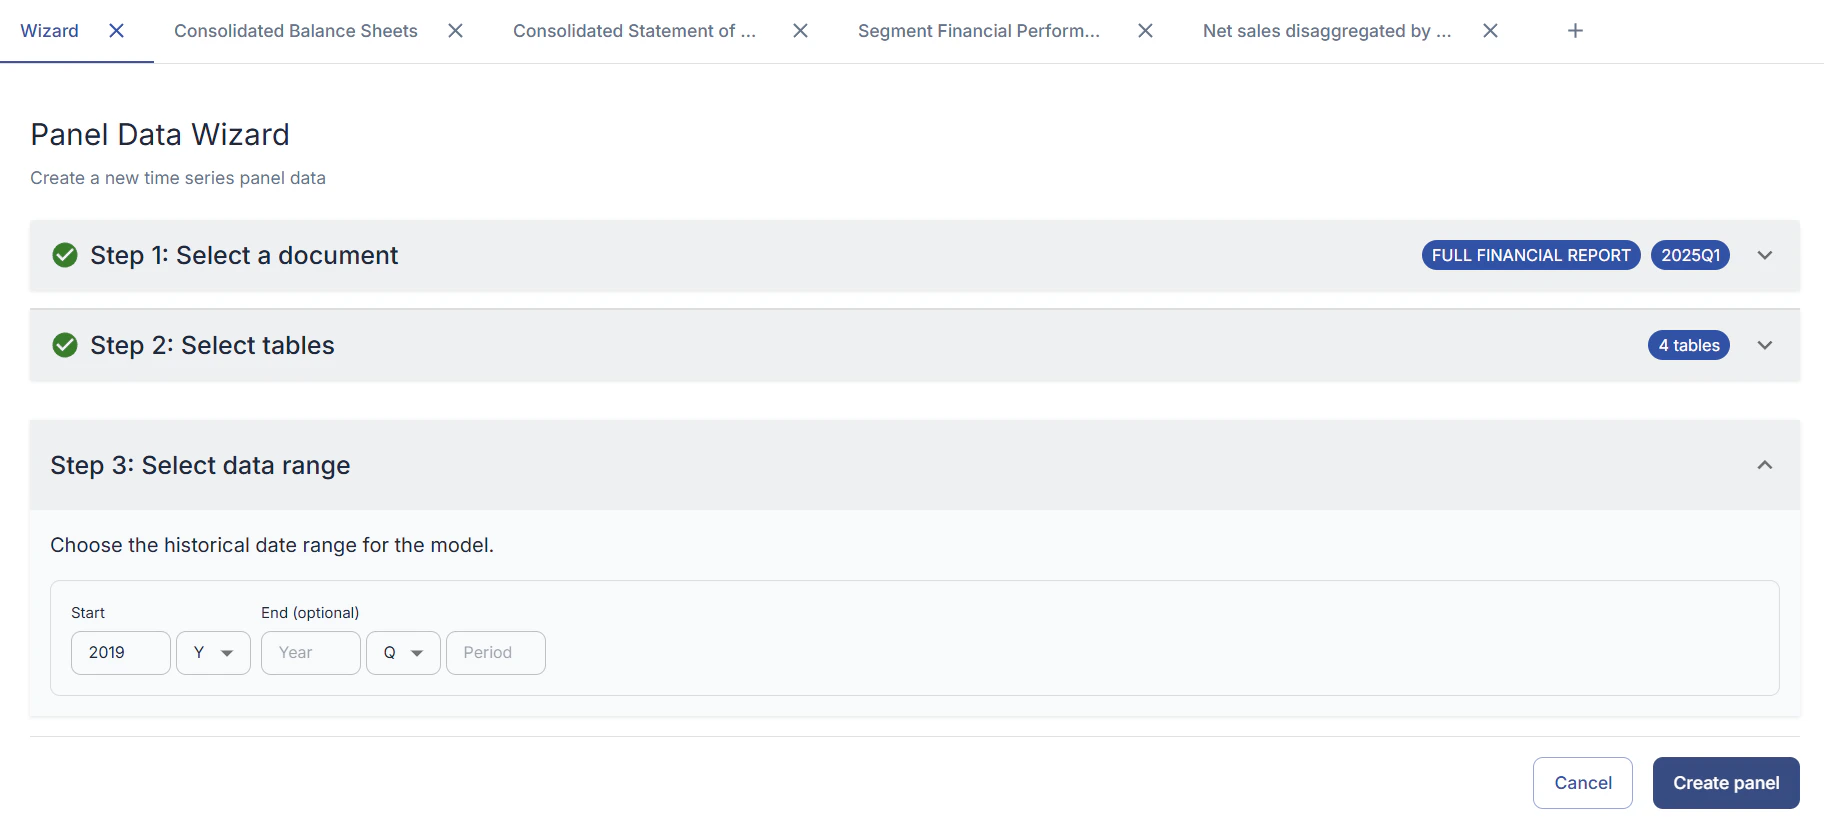
 Finally, select a range of historical periods to include in the model.
Once done, click “Create” and series for each selected table will be automatically added to the model.
Finally, select a range of historical periods to include in the model.
Once done, click “Create” and series for each selected table will be automatically added to the model.
Working with data
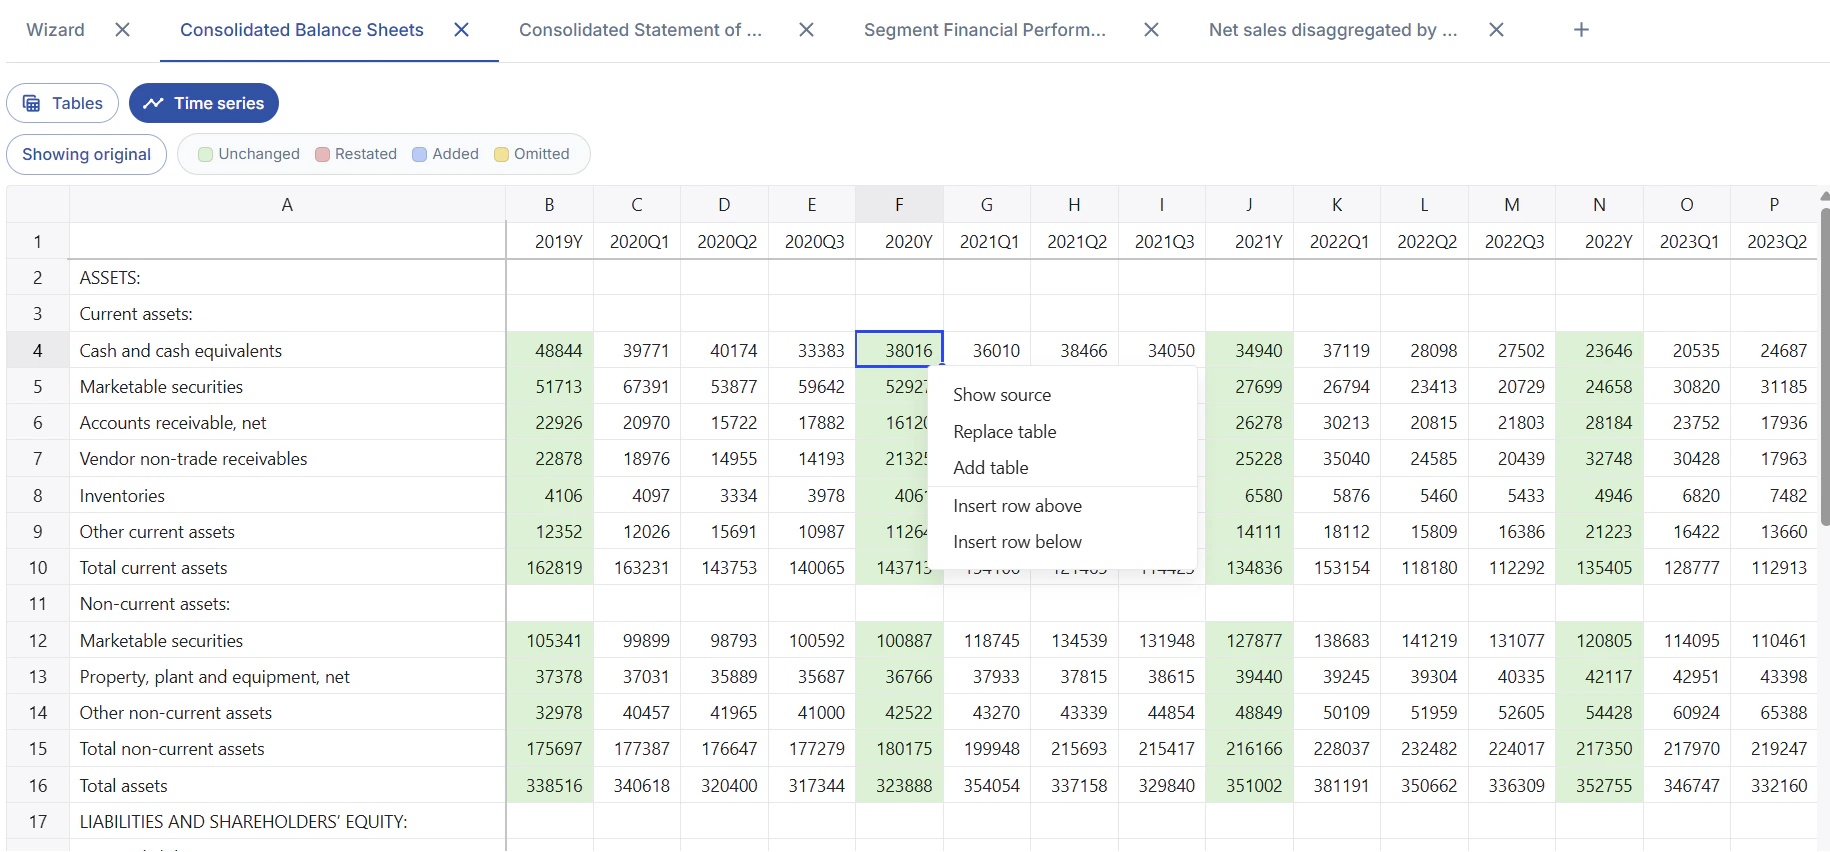
Once the model is created, data will be displayed in a spreadsheet.
This spreadsheet is editable. You can change between the “Time series” view,
which shows the combined line-by-line data, and the “Tables view”, which shows the original tables sequentially.
Restatement analysis is available. See Time series for more information.
You can right click on any cell to view the source of the datapoint.
Right-clicking also gives options to add a missing document, or replace a table with a different one in the same document.
These options are also available via buttons in the ‘Tables’ view.
Exporting your model
Click the ‘Export’ menu at the top of the page to export your model.