Overview
finbar is designed to make it easy to extract relevant data from documents, as well as quickly see related data to any given selection.Table data
Click on any table in a document to see the data in a tabular format. This will show a mini spreadsheet that you can use to copy individual cells, rows, columns, or the entire table into your clipboard.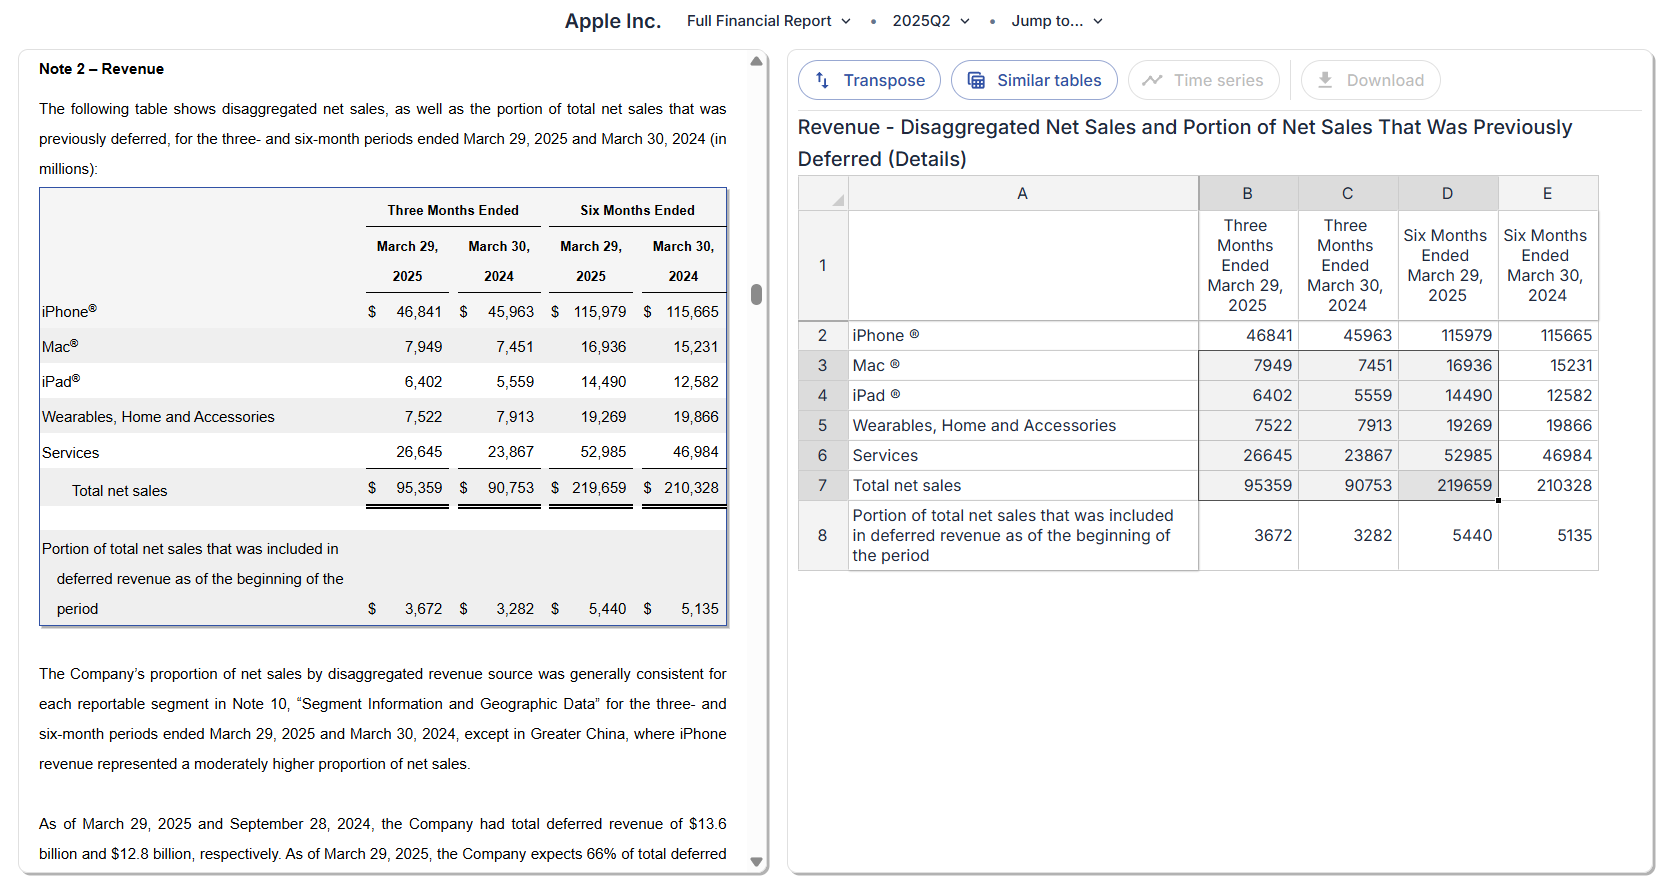
Similar tables
Click the “Similar tables” button to see tables in related documents that are similar to the selected table. Some tables have been pre-processed by finbar to be linked to other tables. These generally are more reliable as they go through our quality control process. For tables that have not yet gone through this process, finbar provides tools for users to perform their own searches. If tables have been pre-processed, similar tables will be automatically displayed. Otherwise, a menu will be displayed. Choose the period within which to search for related tables (optional) and click search. Relevant tables will be displayed. Please take care to verify the tables are appropriate to your selection.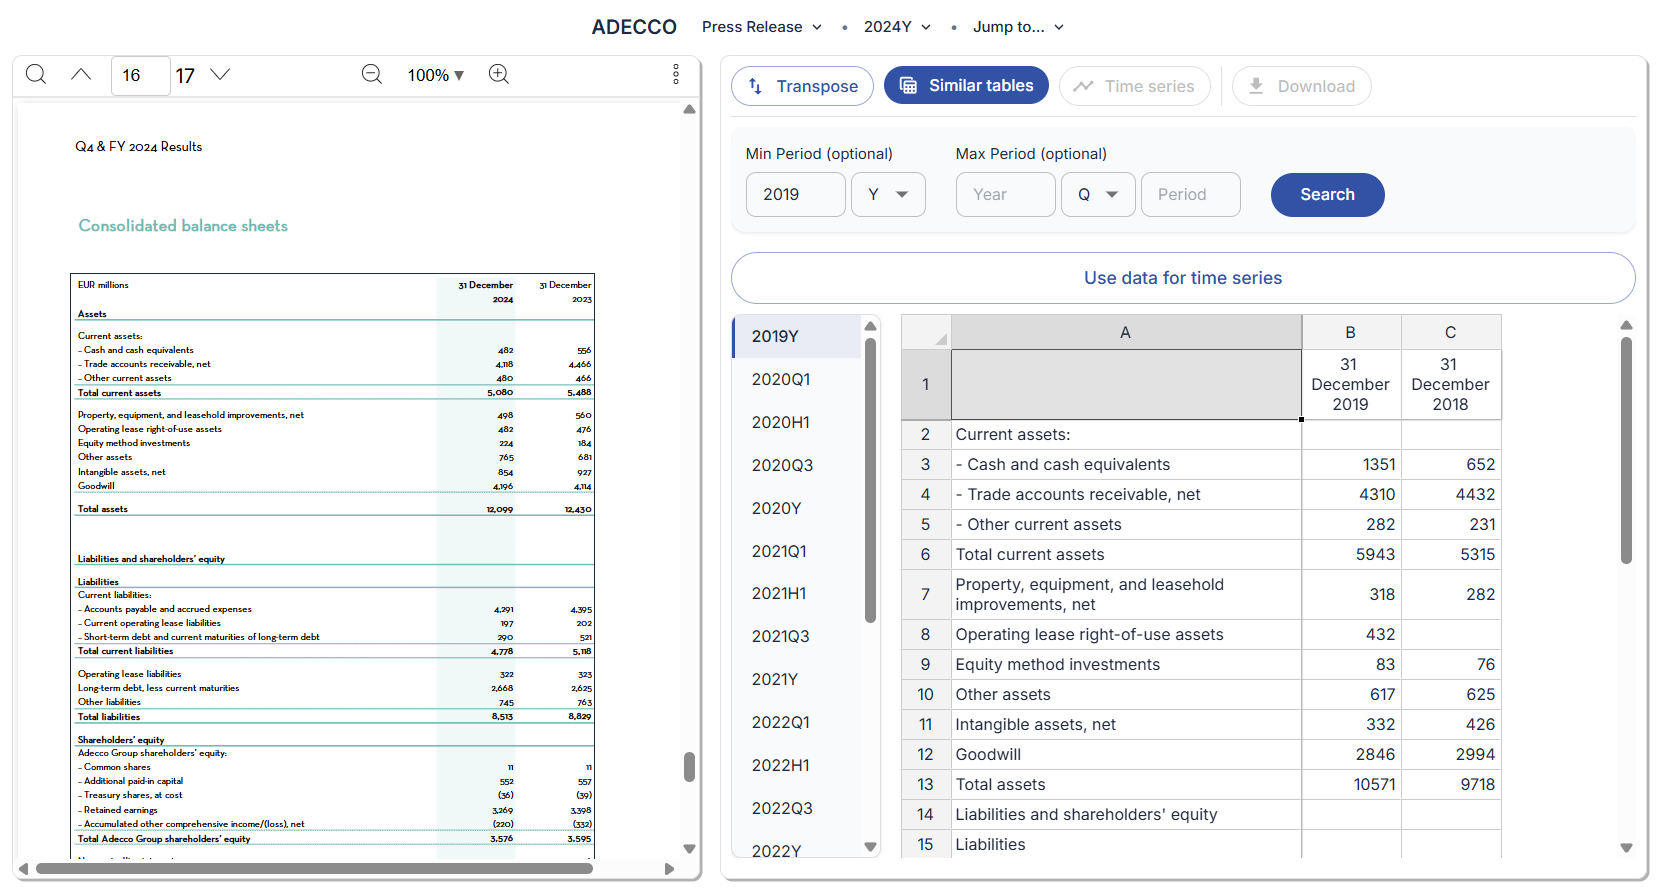
You can right click inside the table and click ‘Go to source’ to view the original source of data. All fundamental data in finbar is always traceable back to its original source.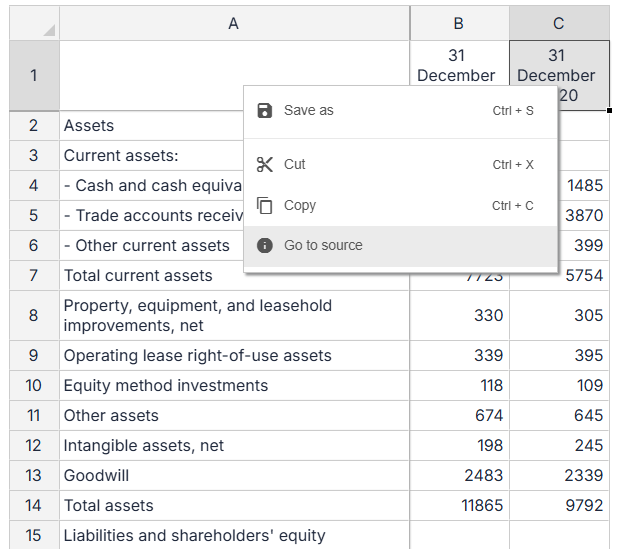
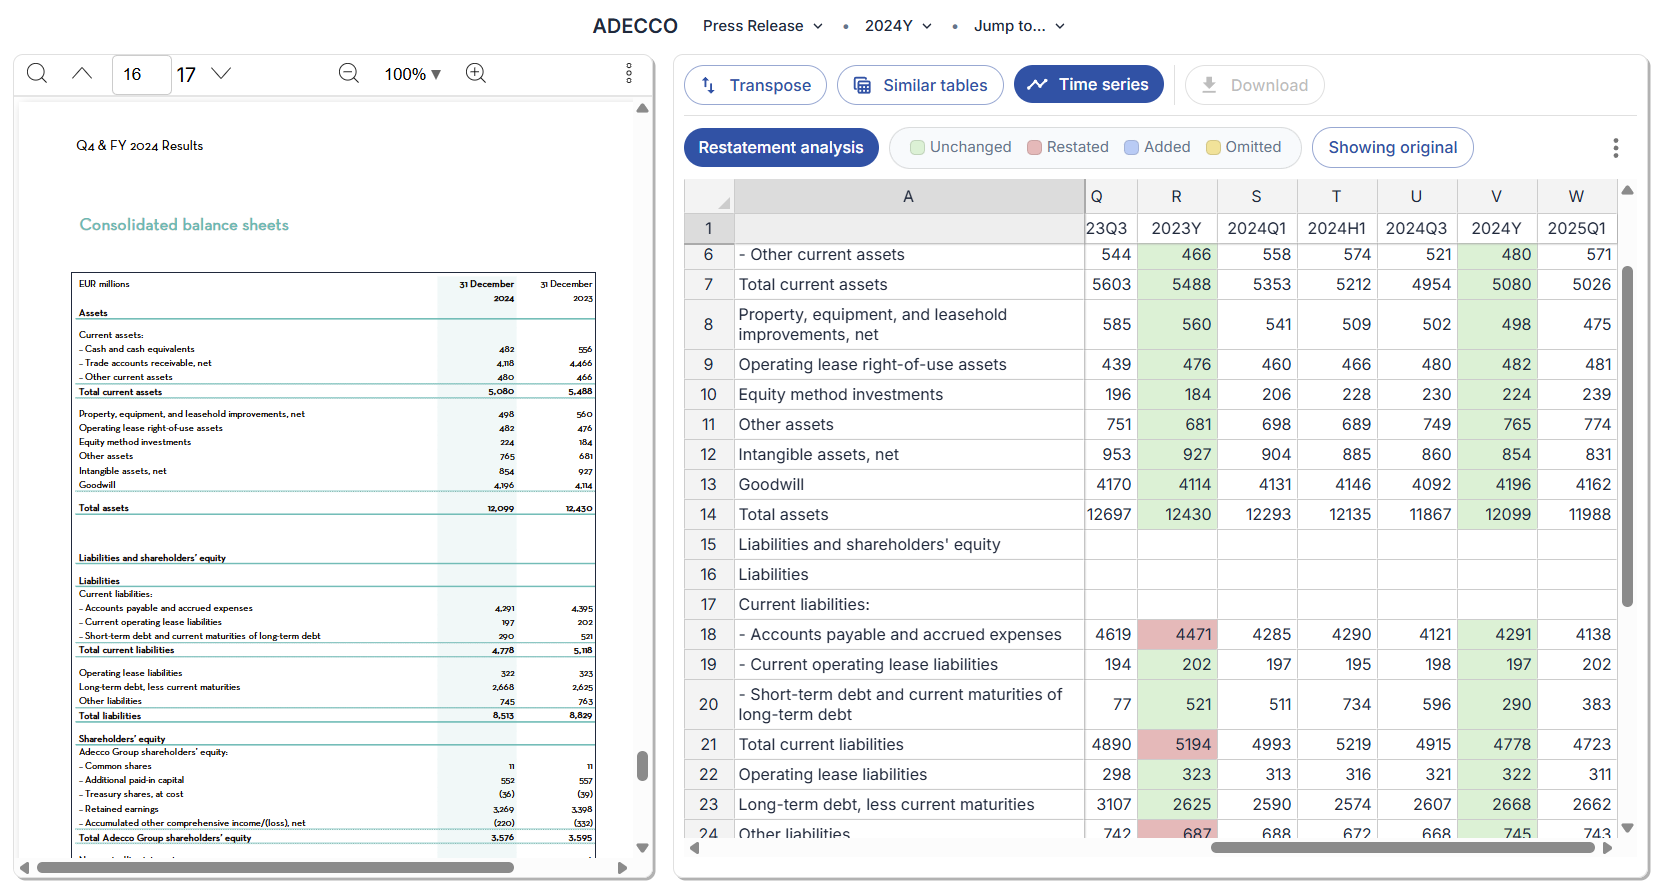
Time series
Like with ‘Similar tables’ data, some tables have been pre-processed by finbar into time series. If not, you must perform a ‘Similar tables’ search and click ‘Use data for time series’ to then generate a time series.